This lesson was written using Aura data, so that students could use data in their own scientific investigations. Below is an overview of the lesson:
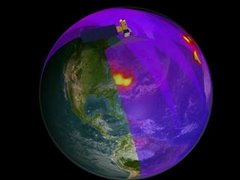
The dataset used in this lesson is monthly averages of NO2 as measured from NASA's EOS Aura spacecraft. NO2 is measured using the Ozone Monitoring Instrument (OMI). OMI is a nadir-pointing instrument that measures trace gases in a column of air directly below the spacecraft. NO2 concentrations are measured in number densities, or the amount of NO2 molecules found in a cubic centimeter of air. Alternately, units of parts per billion can be used, as in the graph at the top of the page. This tells how many NO2 molecules would be found in a sample containing a billion molecules of air. The OMI instrument measures the amount of NO2 in the entire vertical column of air below it, thus the units for OMI measurements are molecules per square centimeter (of the surface).
Purpose: Students will examine data in several formats in order to determine the presence or absence of seasonal variability in tropospheric nitrogen dioxide (NO2) concentrations
For the full lesson plan, please visit the following website:
http://mynasadata.larc.nasa.gov/preview_lesson.php?&passid=59